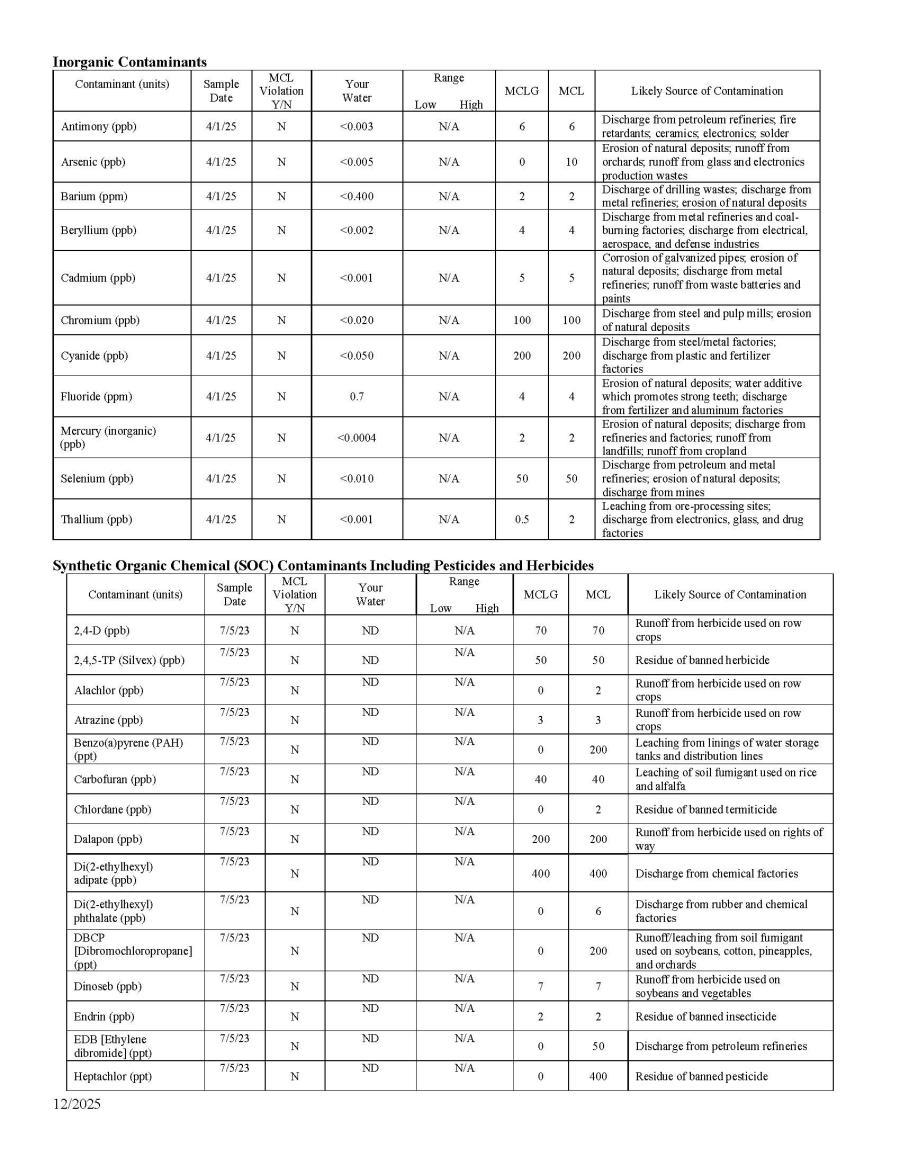
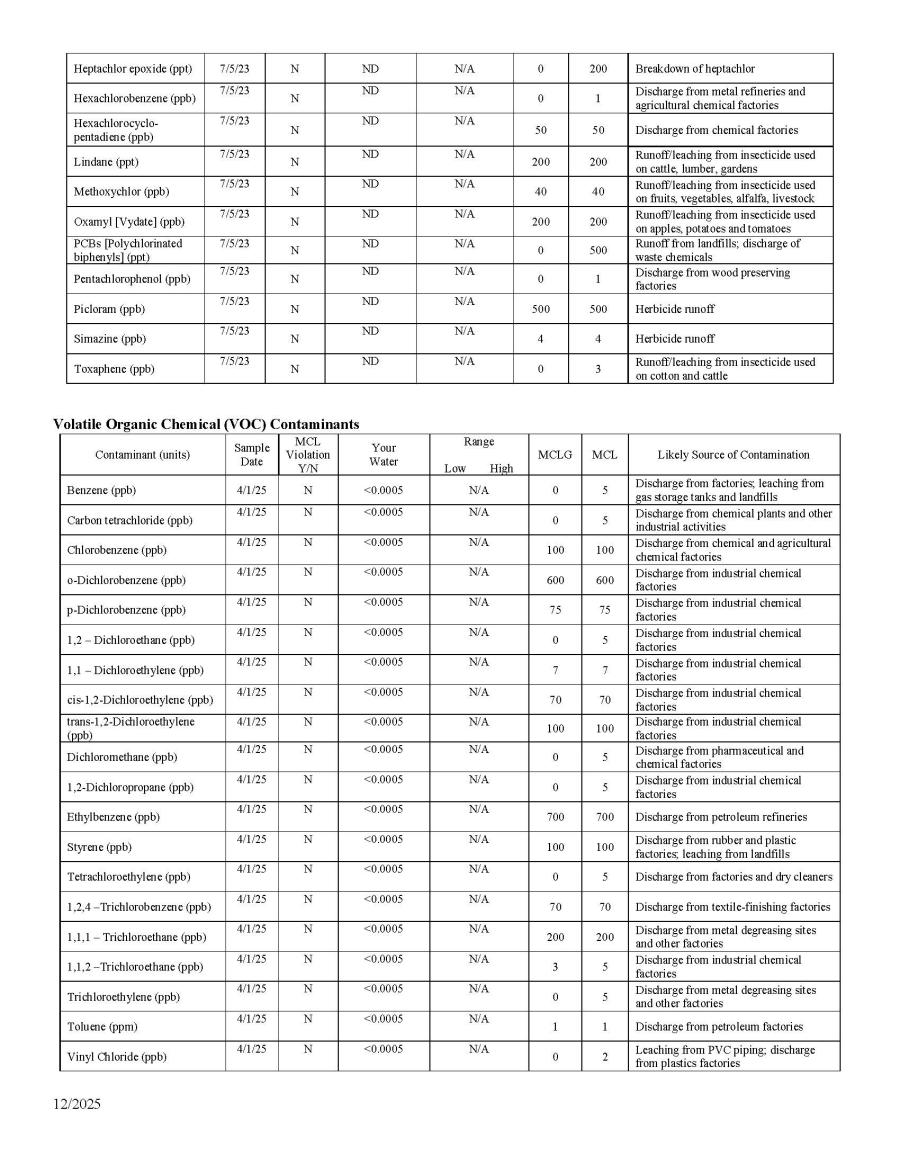
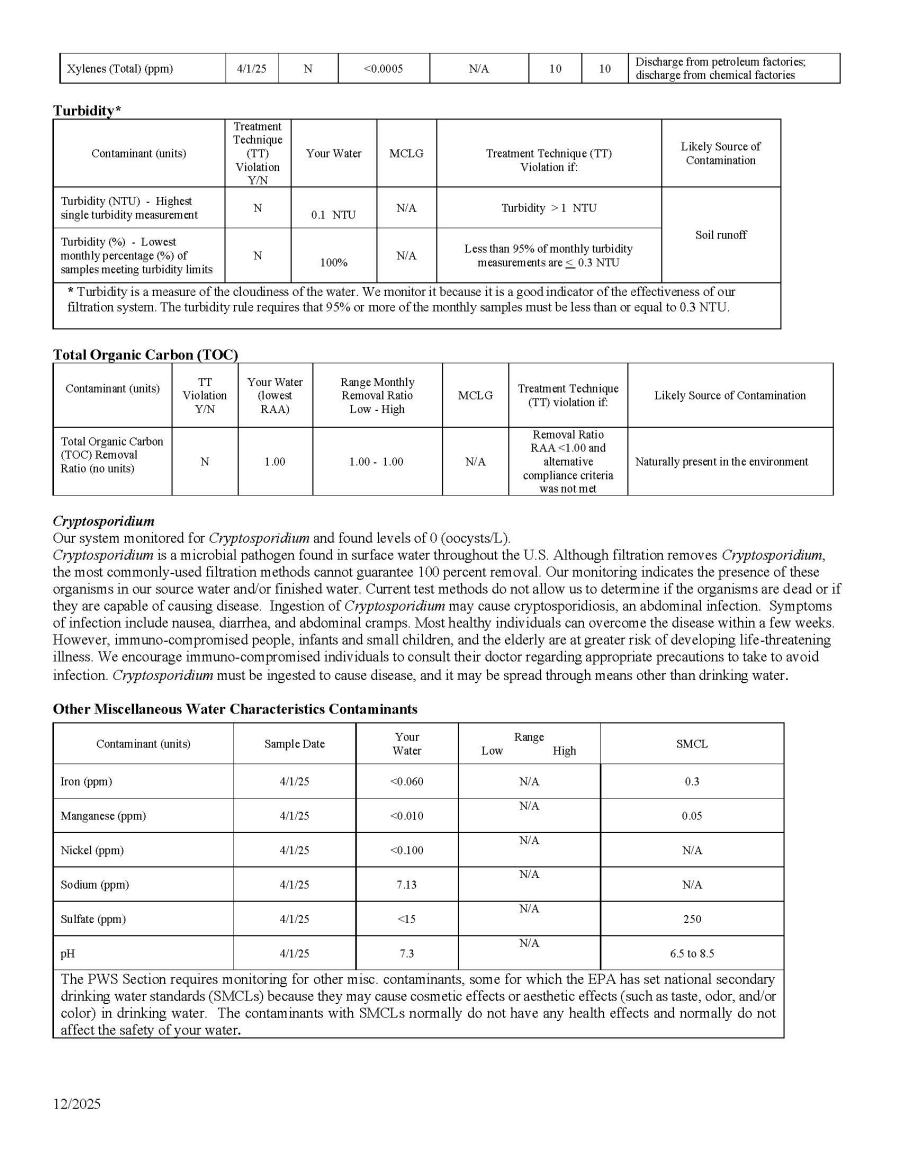
2025 Annual Drinking Water Quality Report
Town of Waynesville
Water System Number: NC 01-44-010
Este informe contiene información muy importante sobre su agua potable. Tradúzcalo o hable con alguien que lo entienda bien.
Introduction
We are pleased to present to you this year's Annual Drinking Water Quality Report. This report is a snapshot of last year’s water quality. Included are details about your source(s) of water, what it contains, and how it compares to standards set by regulatory agencies. Our constant goal is to provide you with a safe and dependable supply of drinking water. We want you to understand the efforts we make to continually improve the water treatment process and protect our water resources. We are committed to ensuring the quality of your water and to providing you with this information because informed customers are our best allies. If you have any questions about this report or concerning your water, please contact Cody Stiles at (828) 820-7270. We want our valued customers to be informed about their water utility. If you want to learn more, please attend any of our regularly scheduled meetings. They are held on the second and fourth Tuesday of every month in the Town Hall Boardroom.
What EPA Wants You to Know
Drinking water, including bottled water, may reasonably be expected to contain at least small amounts of some contaminants. The presence of contaminants does not necessarily indicate that water poses a health risk. More information about contaminants and potential health effects can be obtained by calling the Environmental Protection Agency's Safe Drinking Water Hotline (800-426-4791).
Some people may be more vulnerable to contaminants in drinking water than the general population. Immuno-compromised persons such as persons with cancer undergoing chemotherapy, persons who have undergone organ transplants, people with HIV/AIDS or other immune system disorders, some elderly, and infants can be particularly at risk from infections. These people should seek advice about drinking water from their health care providers. EPA/CDC guidelines on appropriate means to lessen the risk of infection by Cryptosporidium and other microbial contaminants are available from the Safe Drinking Water Hotline (800-426-4791).
The sources of drinking water (both tap water and bottled water) include rivers, lakes, streams, ponds, reservoirs, springs, and wells. As water travels over the surface of the land or through the ground, it dissolves naturally-occurring minerals and, in some cases, radioactive material, and can pick up substances resulting from the presence of animals or from human activity. Contaminants that may be present in source water include:
Microbial Contaminants: such as viruses and bacteria, which may come from sewage treatment plants, septic systems, agricultural livestock operations, and wildlife
Inorganic Contaminants: such as salts and metals, which can be naturally-occurring or result from urban stormwater runoff, industrial or domestic wastewater discharges, oil and gas production, mining, or farming
Pesticides and Herbicides: which may come from a variety of sources such as agriculture, urban stormwater runoff, and residential uses
Organic Chemical Contaminants: including synthetic and volatile organic chemicals, which are by-products of industrial processes and petroleum production, and can also come from gas stations, urban stormwater runoff, and septic systems
Radioactive Contaminants: which can be naturally-occurring or be the result of oil and gas production and mining activities.
In order to ensure that tap water is safe to drink, EPA prescribes regulations which limit the amount of certain contaminants in water provided by public water systems. FDA regulations establish limits for contaminants in bottled water, which must provide the same protection for public health.
Lead in Drinking Water
Lead can cause serious health problems, especially for pregnant women and young children. Lead in drinking water is primarily from materials and components associated with service lines and home plumbing. Town of Waynesville is responsible for providing high quality drinking water and removing lead pipes, but cannot control the variety of materials used in plumbing components in your home. You share the responsibility for protecting yourself and your family from the lead in your home plumbing. You can take responsibility by identifying and removing lead materials within your home plumbing and taking steps to reduce your family's risk. Before drinking tap water, flush your pipes for several minutes by running your tap, taking a shower, doing laundry or a load of dishes. You can also use a filter certified by an American National Standards Institute accredited certifier to reduce lead in drinking water. If you are concerned about lead in your water and wish to have your water tested, contact the Town of Waynesville at (828) 820-7270. Information on lead in drinking water, testing methods, and steps you can take to minimize exposure is available at http://www.epa.gov/safewater/lead.
We have been working to identify service line materials throughout the water system and prepared an inventory of all service lines in our water system. To access this inventory, go to https://pws-ptd.120wateraudit.com/waynesvillenc
When You Turn on Your Tap, Consider the Source
Waynesville’s watershed is located southwest of Waynesville and covers an area of 8400 acres on the headwaters of Allens Creek. Tributary streams within the watershed flow into Waynesville Reservoir, a 50-acre man-made lake created by a dam on Allens Creek. The surface water reservoir and surrounding watershed are classified by the State of North Carolina as WS-1. This classification is the state’s most stringent and forbids development within the watershed boundary.
Source Water Assessment Program (SWAP) Results
The North Carolina Department of Environmental Quality (DEQ), Public Water Supply (PWS) Section, Source Water Assessment Program (SWAP) conducted assessments for all drinking water sources across North Carolina. The purpose of the assessments was to determine the susceptibility of each drinking water source (well or surface water intake) to Potential Contaminant Sources (PCSs). The results of the assessment are available in SWAP Assessment Reports that include maps, background information and a relative susceptibility rating of Higher, Moderate or Lower.
The relative susceptibility rating of each source for the Town of Waynesville was determined by combining the contaminant rating (number and location of PCSs within the assessment area) and the inherent vulnerability rating (i.e., characteristics or existing conditions of the well or watershed and its delineated assessment area). The assessment findings are summarized in the table below:
Susceptibility of Sources to Potential Contaminant Sources (PCSs)
|
Source Name |
Susceptibility Rating |
SWAP Report Date |
|
Allen Creek Reservoir |
Moderate |
September 2020 |
It is important to understand that a susceptibility rating of “higher” does not imply poor water quality, only the system’s potential to become contaminated by PCSs in the assessment area.
Help Protect Your Source Water
Protection of drinking water is everyone’s responsibility. You can help protect your community’s drinking water source(s) in several ways: (examples: dispose of chemicals properly; take used motor oil to a recycling center, volunteer in your community to participate in group efforts to protect your source, etc.).
Violations that Your Water System Received for the Report Year
During 2025, or during any compliance period that ended in 2025, we received no violations.
Important Drinking Water Definitions:
Action Level (AL) - The concentration of a contaminant which, if exceeded, triggers treatment or other requirements which a water system must follow.
Herbicide – Any chemical(s) used to control undesirable vegetation.
Maximum Contaminant Level (MCL) - The highest level of a contaminant that is allowed in drinking water. MCLs are set as close to the MCLGs as feasible using the best available treatment technology.
Maximum Contaminant Level Goal (MCLG) - The level of a contaminant in drinking water below which there is no known or expected risk to health. MCLGs allow for a margin of safety.
Parts per million (ppm) or Milligrams per liter (mg/L) - One part per million corresponds to one minute in two years or a single penny in $10,000.
Parts per billion (ppb) or Micrograms per liter (ug/L) - One part per billion corresponds to one minute in 2,000 years, or a single penny in $10,000,000.
Pesticide – Generally, any substance or mixture of substances intended for preventing, destroying, repelling, or mitigating any pest.
---------------------------------------------------------------------------------------------------------------------------------------------------------
Level 1 Assessment - A Level 1 assessment is a study of the water system to identify potential problems and determine (if possible) why total coliform bacteria have been found in our water system.
Level 2 Assessment - A Level 2 assessment is a very detailed study of the water system to identify potential problems and determine (if possible) why an E. coli MCL violation has occurred and/or why total coliform bacteria have been found in our water system on multiple occasions.
Locational Running Annual Average (LRAA) – The average of sample analytical results for samples taken at a particular monitoring location during the previous four calendar quarters under the Stage 2 Disinfectants and Disinfection Byproducts Rule.
Maximum Residual Disinfection Level (MRDL) – The highest level of a disinfectant allowed in drinking water. There is convincing evidence that addition of a disinfectant is necessary for control of microbial contaminants.
Maximum Residual Disinfection Level Goal (MRDLG) – The level of a drinking water disinfectant below which there is no known or expected risk to health. MRDLGs do not reflect the benefits of the use of disinfectants to control microbial contaminants.
Million Fibers per Liter (MFL) - Million fibers per liter is a measure of the presence of asbestos fibers that are longer than 10 micrometers.
Nephelometric Turbidity Unit (NTU) - Nephelometric turbidity unit is a measure of the clarity of water. Turbidity in excess of 5 NTU is just noticeable to the average person.
Not-Applicable (N/A) – Information not applicable/not required for that particular water system or for that particular rule.
Non-Detects (ND) - Laboratory analysis indicates that the contaminant is not present at the level of detection set for the particular methodology used.
Parts per trillion (ppt) or Nanograms per liter (nanograms/L) - One part per trillion corresponds to one minute in 2,000,000 years, or a single penny in $10,000,000,000.
Parts per quadrillion (ppq) or Picograms per liter (picograms/L) - One part per quadrillion corresponds to one minute in 2,000,000,000 years or one penny in $10,000,000,000,000.
Picocuries per liter (pCi/L) - Picocuries per liter is a measure of the radioactivity in water.
Running Annual Average (RAA) – The average of sample analytical results for samples taken during the previous four calendar quarters.
Treatment Technique (TT) - A required process intended to reduce the level of a contaminant in drinking water.
Variances and Exceptions – State or EPA permission not to meet an MCL or Treatment Technique under certain conditions.
Water Quality Data Tables of Detected Contaminants
We routinely monitor for over 150 contaminants in your drinking water according to Federal and State laws. The tables below list all the drinking water contaminants that we detected in the last round of sampling for each particular contaminant group. The presence of contaminants does not necessarily indicate that water poses a health risk. Unless otherwise noted, the data presented in this table is from testing done January 1 through December 31, 2025. The EPA and the State allow us to monitor for certain contaminants less than once per year because the concentrations of these contaminants are not expected to vary significantly from year to year. Some of the data, though representative of the water quality, is more than one year old.
Lead and Copper Contaminants
| The table summarizes our most recent lead and copper tap sampling data. If you would like to review the complete lead tap sampling data, please email us at cstiles1@waynesvillenc.gov | |||||||
|
Contaminant (units)
|
Sample Date |
Your Water (90th Percentile) |
Number of sites found above the AL |
Range
Low High |
MCLG |
AL |
Likely Source of Contamination |
|
Copper (ppm) (90th percentile) |
9/4/24 |
<0.050 |
0 |
<0.050 .076 |
1.3 |
AL=1.3 |
Corrosion of household plumbing systems; erosion of natural deposits |
|
Lead (ppb) (90th percentile) |
9/4/24 |
< 3 |
0 |
< 3 < 3 |
0 |
AL=15 |
Corrosion of household plumbing systems; erosion of natural deposits |
Stage 2 Disinfection Byproducts (DBPs) Total Trihalomethanes (TTHM) and Haloacetic Acids (five) (HAA5)
|
Disinfection Byproduct |
Year Sampled |
MCL Violation Y/N |
Your Water |
Range
Low High |
MCLG |
MCL |
Likely Source of Contamination |
|
TTHM (ppb) |
2025 |
N |
35 |
17 44 |
N/A |
80 |
Byproduct of drinking water disinfection |
|
HAA5 (ppb) |
2025 |
N |
24 |
15 27 |
N/A |
60 |
Byproduct of drinking water disinfection |
Disinfectant Residuals Summary
|
|
MRDL Violation Y/N |
Your Water (RAA) |
Range Low High |
MRDLG |
MRDL |
Likely Source of Contamination |
|
Chlorine (ppm) |
N |
.95 PPM |
.3ppm 1.5ppm |
4 |
4.0 |
Water additive used to control microbes |
Asbestos Contaminant
|
Contaminant (units)
|
Sample Date |
MCL Violation Y/N |
Your Water |
Range
Low High |
MCLG |
MCL |
Likely Source of Contamination |
|
Total Asbestos (MFL) |
7/6/21 |
N |
<0.1483 |
N/A |
7 |
7 |
Decay of asbestos cement water mains; erosion of natural deposits |
Nitrate/Nitrite Contaminants
|
Contaminant (units)
|
Sample Date |
MCL Violation Y/N |
Your Water |
Range
Low High |
MCLG |
MCL |
Likely Source of Contamination |
| Nitrate (as Nitrogen) (ppm) |
4/1/25 |
N |
ND |
N/A |
10 |
10 |
Runoff from fertilizer use; leaching from septic tanks, sewage; erosion of natural deposits |
Inorganic Contaminants
|
Contaminant (units)
|
Sample Date |
MCL Violation Y/N |
Your Water |
Range
Low High |
MCLG |
MCL |
Likely Source of Contamination |
| Antimony (ppb) |
4/1/25 |
N |
<0.003 |
N/A |
6 |
6 |
Discharge from petroleum refineries; fire retardants; ceramics; electronics; solder |
| Arsenic (ppb) |
4/1/25 |
N |
<0.005 |
N/A |
0 |
10 |
Erosion of natural deposits; runoff from orchards; runoff from glass and electronics production wastes |
| Barium (ppm) |
4/1/25 |
N |
<0.400 |
N/A |
2 |
2 |
Discharge of drilling wastes; discharge from metal refineries; erosion of natural deposits |
| Beryllium (ppb) |
4/1/25 |
N |
<0.002 |
N/A |
4 |
4 |
Discharge from metal refineries and coal-burning factories; discharge from electrical, aerospace, and defense industries |
| Cadmium (ppb) |
4/1/25 |
N |
<0.001 |
N/A |
5 |
5 |
Corrosion of galvanized pipes; erosion of natural deposits; discharge from metal refineries; runoff from waste batteries and paints |
| Chromium (ppb) |
4/1/25 |
N |
<0.020 |
N/A |
100 |
100 |
Discharge from steel and pulp mills; erosion of natural deposits |
| Cyanide (ppb) |
4/1/25 |
N |
<0.050 |
N/A |
200 |
200 |
Discharge from steel/metal factories; discharge from plastic and fertilizer factories |
| Fluoride (ppm) |
4/1/25 |
N |
0.7 |
N/A |
4 |
4 |
Erosion of natural deposits; water additive which promotes strong teeth; discharge from fertilizer and aluminum factories |
| Mercury (inorganic) (ppb) |
4/1/25 |
N |
<0.0004 |
N/A |
2 |
2 |
Erosion of natural deposits; discharge from refineries and factories; runoff from landfills; runoff from cropland |
| Selenium (ppb) |
4/1/25 |
N |
<0.010 |
N/A |
50 |
50 |
Discharge from petroleum and metal refineries; erosion of natural deposits; discharge from mines |
| Thallium (ppb) |
4/1/25 |
N |
<0.001 |
N/A |
0.5 |
2 |
Leaching from ore-processing sites; discharge from electronics, glass, and drug factories |
Synthetic Organic Chemical (SOC) Contaminants Including Pesticides and Herbicides
|
Contaminant (units)
|
Sample Date |
MCL Violation Y/N |
Your Water |
Range
Low High |
MCLG |
MCL |
Likely Source of Contamination |
| 2,4-D (ppb) |
7/5/23 |
N |
ND |
N/A |
70 |
70 |
Runoff from herbicide used on row crops |
| 2,4,5-TP (Silvex) (ppb) |
7/5/23 |
N |
ND |
N/A |
50 |
50 |
Residue of banned herbicide |
| Alachlor (ppb) |
7/5/23 |
N |
ND |
N/A |
0 |
2 |
Runoff from herbicide used on row crops |
| Atrazine (ppb) |
7/5/23 |
N |
ND |
N/A |
3 |
3 |
Runoff from herbicide used on row crops |
| Benzo(a)pyrene (PAH) (ppt) |
7/5/23 |
N |
ND |
N/A |
0 |
200 |
Leaching from linings of water storage tanks and distribution lines |
| Carbofuran (ppb) |
7/5/23 |
N |
ND |
N/A |
40 |
40 |
Leaching of soil fumigant used on rice and alfalfa |
| Chlordane (ppb) |
7/5/23 |
N |
ND |
N/A |
0 |
2 |
Residue of banned termiticide |
| Dalapon (ppb) |
7/5/23 |
N |
ND |
N/A |
200 |
200 |
Runoff from herbicide used on rights of way |
|
Di(2-ethylhexyl) adipate (ppb)
|
7/5/23 |
N |
ND |
N/A |
400 |
400 |
Discharge from chemical factories |
|
Di(2-ethylhexyl) phthalate (ppb)
|
7/5/23 |
N |
ND |
N/A |
0 |
6 |
Discharge from rubber and chemical factories |
| DBCP [Dibromochloropropane] (ppt) |
7/5/23 |
N |
ND |
N/A |
0 |
200 |
Runoff/leaching from soil fumigant used on soybeans, cotton, pineapples, and orchards |
| Dinoseb (ppb) |
7/5/23 |
N |
ND |
N/A |
7 |
7 |
Runoff from herbicide used on soybeans and vegetables |
| Endrin (ppb) |
7/5/23 |
N |
ND |
N/A |
2 |
2 |
Residue of banned insecticide |
| EDB [Ethylene dibromide] (ppt) |
7/5/23 |
N |
ND |
N/A |
0 |
50 |
Discharge from petroleum refineries |
| Heptachlor (ppt) |
7/5/23 |
N |
ND |
N/A |
0 |
400 |
Residue of banned pesticide |
| Heptachlor epoxide (ppt) |
7/5/23 |
N |
ND |
N/A |
0 |
200 |
Breakdown of heptachlor |
| Hexachlorobenzene (ppb) |
7/5/23 |
N |
ND |
N/A |
0 |
1 |
Discharge from metal refineries and agricultural chemical factories |
| Hexachlorocyclo-pentadiene (ppb) |
7/5/23 |
N |
ND |
N/A |
50 |
50 |
Discharge from chemical factories |
| Lindane (ppt) |
7/5/23 |
N |
ND |
N/A |
200 |
200 |
Runoff/leaching from insecticide used on cattle, lumber, gardens |
| Methoxychlor (ppb) |
7/5/23 |
N |
ND |
N/A |
40 |
40 |
Runoff/leaching from insecticide used on fruits, vegetables, alfalfa, livestock |
| Oxamyl [Vydate] (ppb) |
7/5/23 |
N |
ND |
N/A |
200 |
200 |
Runoff/leaching from insecticide used on apples, potatoes and tomatoes |
| PCBs [Polychlorinated biphenyls] (ppt) |
7/5/23 |
N |
ND |
N/A |
0 |
500 |
Runoff from landfills; discharge of waste chemicals |
| Pentachlorophenol (ppb) |
7/5/23 |
N |
ND |
N/A |
0 |
1 |
Discharge from wood preserving factories |
| Picloram (ppb) |
7/5/23 |
N |
ND |
N/A |
500 |
500 |
Herbicide runoff |
| Simazine (ppb) |
7/5/23 |
N |
ND |
N/A |
4 |
4 |
Herbicide runoff |
| Toxaphene (ppb) |
7/5/23 |
N |
ND |
N/A |
0 |
3 |
Runoff/leaching from insecticide used on cotton and cattle |
Volatile Organic Chemical (VOC) Contaminants
|
Contaminant (units)
|
Sample Date |
MCL Violation Y/N |
Your Water |
Range
Low High |
MCLG |
MCL |
Likely Source of Contamination |
| Benzene (ppb) |
4/1/25 |
N |
<0.0005 |
N/A |
0 |
5 |
Discharge from factories; leaching from gas storage tanks and landfills |
| Carbon tetrachloride (ppb) |
4/1/25 |
N |
<0.0005 |
N/A |
0 |
5 |
Discharge from chemical plants and other industrial activities |
| Chlorobenzene (ppb) |
4/1/25 |
N |
<0.0005 |
N/A |
100 |
100 |
Discharge from chemical and agricultural chemical factories |
| o-Dichlorobenzene (ppb) |
4/1/25 |
N |
<0.0005 |
N/A |
600 |
600 |
Discharge from industrial chemical factories |
| p-Dichlorobenzene (ppb) |
4/1/25 |
N |
<0.0005 |
N/A |
75 |
75 |
Discharge from industrial chemical factories |
| 1,2 – Dichloroethane (ppb) |
4/1/25 |
N |
<0.0005 |
N/A |
0 |
5 |
Discharge from industrial chemical factories |
| 1,1 – Dichloroethylene (ppb) |
4/1/25 |
N |
<0.0005 |
N/A |
7 |
7 |
Discharge from industrial chemical factories |
| cis-1,2-Dichloroethylene (ppb) |
4/1/25 |
N |
<0.0005 |
N/A |
70 |
70 |
Discharge from industrial chemical factories |
| trans-1,2-Dichloroethylene (ppb) |
4/1/25 |
N |
<0.0005 |
N/A |
100 |
100 |
Discharge from industrial chemical factories |
| Dichloromethane (ppb) |
4/1/25 |
N |
<0.0005 |
N/A |
0 |
5 |
Discharge from pharmaceutical and chemical factories |
| 1,2-Dichloropropane (ppb) |
4/1/25 |
N |
<0.0005 |
N/A |
0 |
5 |
Discharge from industrial chemical factories |
| Ethylbenzene (ppb) |
4/1/25 |
N |
<0.0005 |
N/A |
700 |
700 |
Discharge from petroleum refineries |
| Styrene (ppb) |
4/1/25 |
N |
<0.0005 |
N/A |
100 |
100 |
Discharge from rubber and plastic factories; leaching from landfills |
| Tetrachloroethylene (ppb) |
4/1/25 |
N |
<0.0005 |
N/A |
0 |
5 |
Discharge from factories and dry cleaners |
| 1,2,4 –Trichlorobenzene (ppb) |
4/1/25 |
N |
<0.0005 |
N/A |
70 |
70 |
Discharge from textile-finishing factories |
| 1,1,1 – Trichloroethane (ppb) |
4/1/25 |
N |
<0.0005 |
N/A |
200 |
200 |
Discharge from metal degreasing sites and other factories |
| 1,1,2 –Trichloroethane (ppb) |
4/1/25 |
N |
<0.0005 |
N/A |
3 |
5 |
Discharge from industrial chemical factories |
| Trichloroethylene (ppb) |
4/1/25 |
N |
<0.0005 |
N/A |
0 |
5 |
Discharge from metal degreasing sites and other factories |
| Toluene (ppm) |
4/1/25 |
N |
<0.0005 |
N/A |
1 |
1 |
Discharge from petroleum factories |
| Vinyl Chloride (ppb) |
4/1/25 |
N |
<0.0005 |
N/A |
0 |
2 |
Leaching from PVC piping; discharge from plastics factories |
| Xylenes (Total) (ppm) |
4/1/25 |
N |
<0.0005 |
N/A |
10 |
10 |
Discharge from petroleum factories; discharge from chemical factories |
Turbidity*
|
Contaminant (units)
|
Treatment Technique (TT) Violation Y/N |
Your Water |
MCLG |
Treatment Technique (TT) Violation if:
|
Likely Source of Contamination |
| Turbidity (NTU) - Highest single turbidity measurement |
N |
0.1 NTU |
N/A |
Turbidity > 1 NTU
|
Soil runoff |
| Turbidity (%) - Lowest monthly percentage (%) of samples meeting turbidity limits |
N |
100% |
N/A |
Less than 95% of monthly turbidity measurements are < 0.3 NTU
|
|
|
* Turbidity is a measure of the cloudiness of the water. We monitor it because it is a good indicator of the effectiveness of our filtration system. The turbidity rule requires that 95% or more of the monthly samples must be less than or equal to 0.3 NTU.
|
|||||
Total Organic Carbon (TOC)
|
Contaminant (units)
|
TT Violation Y/N |
Your Water (lowest RAA) |
Range Monthly Removal Ratio Low - High |
MCLG |
Treatment Technique (TT) violation if: |
Likely Source of Contamination |
|
Total Organic Carbon (TOC) Removal Ratio (no units)
|
N |
1.00 |
1.00 - 1.00 |
N/A |
Removal Ratio RAA <1.00 and alternative compliance criteria was not met |
Naturally present in the environment |
Cryptosporidium
Our system monitored for Cryptosporidium and found levels of 0 (oocysts/L).
Cryptosporidiumis a microbial pathogen found in surface water throughout the U.S. Although filtration removes Cryptosporidium, the most commonly-used filtration methods cannot guarantee 100 percent removal. Our monitoring indicates the presence of these organisms in our source water and/or finished water. Current test methods do not allow us to determine if the organisms are dead or if they are capable of causing disease. Ingestion of Cryptosporidium may cause cryptosporidiosis, an abdominal infection. Symptoms of infection include nausea, diarrhea, and abdominal cramps. Most healthy individuals can overcome the disease within a few weeks. However, immuno-compromised people, infants and small children, and the elderly are at greater risk of developing life-threatening illness. We encourage immuno-compromised individuals to consult their doctor regarding appropriate precautions to take to avoid infection. Cryptosporidium must be ingested to cause disease, and it may be spread through means other than drinking water.
Other Miscellaneous Water Characteristics Contaminants
|
Contaminant (units)
|
Sample Date |
Your Water |
Range Low High |
SMCL |
| Iron (ppm) |
4/1/25 |
<0.060 |
N/A |
0.3 |
| Manganese (ppm) |
4/1/25 |
<0.010 |
N/A |
0.05 |
| Nickel (ppm) |
4/1/25 |
<0.100 |
N/A |
N/A |
| Sodium (ppm) |
4/1/25 |
7.13 |
N/A |
N/A |
| Sulfate (ppm) |
4/1/25 |
<15 |
N/A |
250 |
| pH |
4/1/25 |
7.3 |
N/A |
6.5 to 8.5 |
|
The PWS Section requires monitoring for other misc. contaminants, some for which the EPA has set national secondary drinking water standards (SMCLs) because they may cause cosmetic effects or aesthetic effects (such as taste, odor, and/or color) in drinking water. The contaminants with SMCLs normally do not have any health effects and normally do not affect the safety of your water. |
||||